


Every immersive experience project eventually meets the same question in a budget review: what did we get for it. Too often the answer is a highlight reel and a feeling. That is enough to win applause in the room and lose the line item the following year. The brands that keep investing in AR, VR, and experiential are the ones that can point to a number a CFO recognizes.
The good news is that immersive experiences are measurable, arguably more measurable than a billboard or a thirty-second spot, because participation leaves a trail. The catch is that the measurement has to be designed in from the brief. You cannot bolt analytics onto an experience after it ships. This is a practical framework for tying an immersive experience to a business metric before a single asset is built, and for proving the return after.
Why “it went viral” is not a KPI
“It went viral” is the most seductive and least useful thing a team can say about an activation. It is unfalsifiable, it is unrepeatable, and it does not map to anything a finance team can act on. Views and buzz feel like results, but on their own they are vanity metrics: they describe attention without connecting it to a business outcome.
The fix is not to abandon reach; it is to demote it. Reach is the top of a stack, not the whole story. Before you brief a creative team, name the one business metric the experience exists to move. Leads. Sign-ups. Sales lift in a market. Qualified pipeline. Sampling conversions. Everything else you measure should ladder up to that. When the primary metric is set first, the creative gets sharper, because every decision has a job, and the measurement gets honest, because you agreed what success was before you knew whether you hit it.
The metric stack
Immersive experiences produce a layered set of signals. Read them as a stack, from the widest and softest at the top to the hardest and most decision-ready at the bottom.
- Reach. How many people encountered the experience or its content. This includes on-site impressions, video wall viewers, and the media that covers it. Sleep Number’s Super Bowl activation generated more than 481 million earned media impressions and 21.6 million social impressions; Modelo’s UFC tour logged 35,000 on-site customer impressions across its events. Reach is real, but it is the beginning of the argument, not the end.
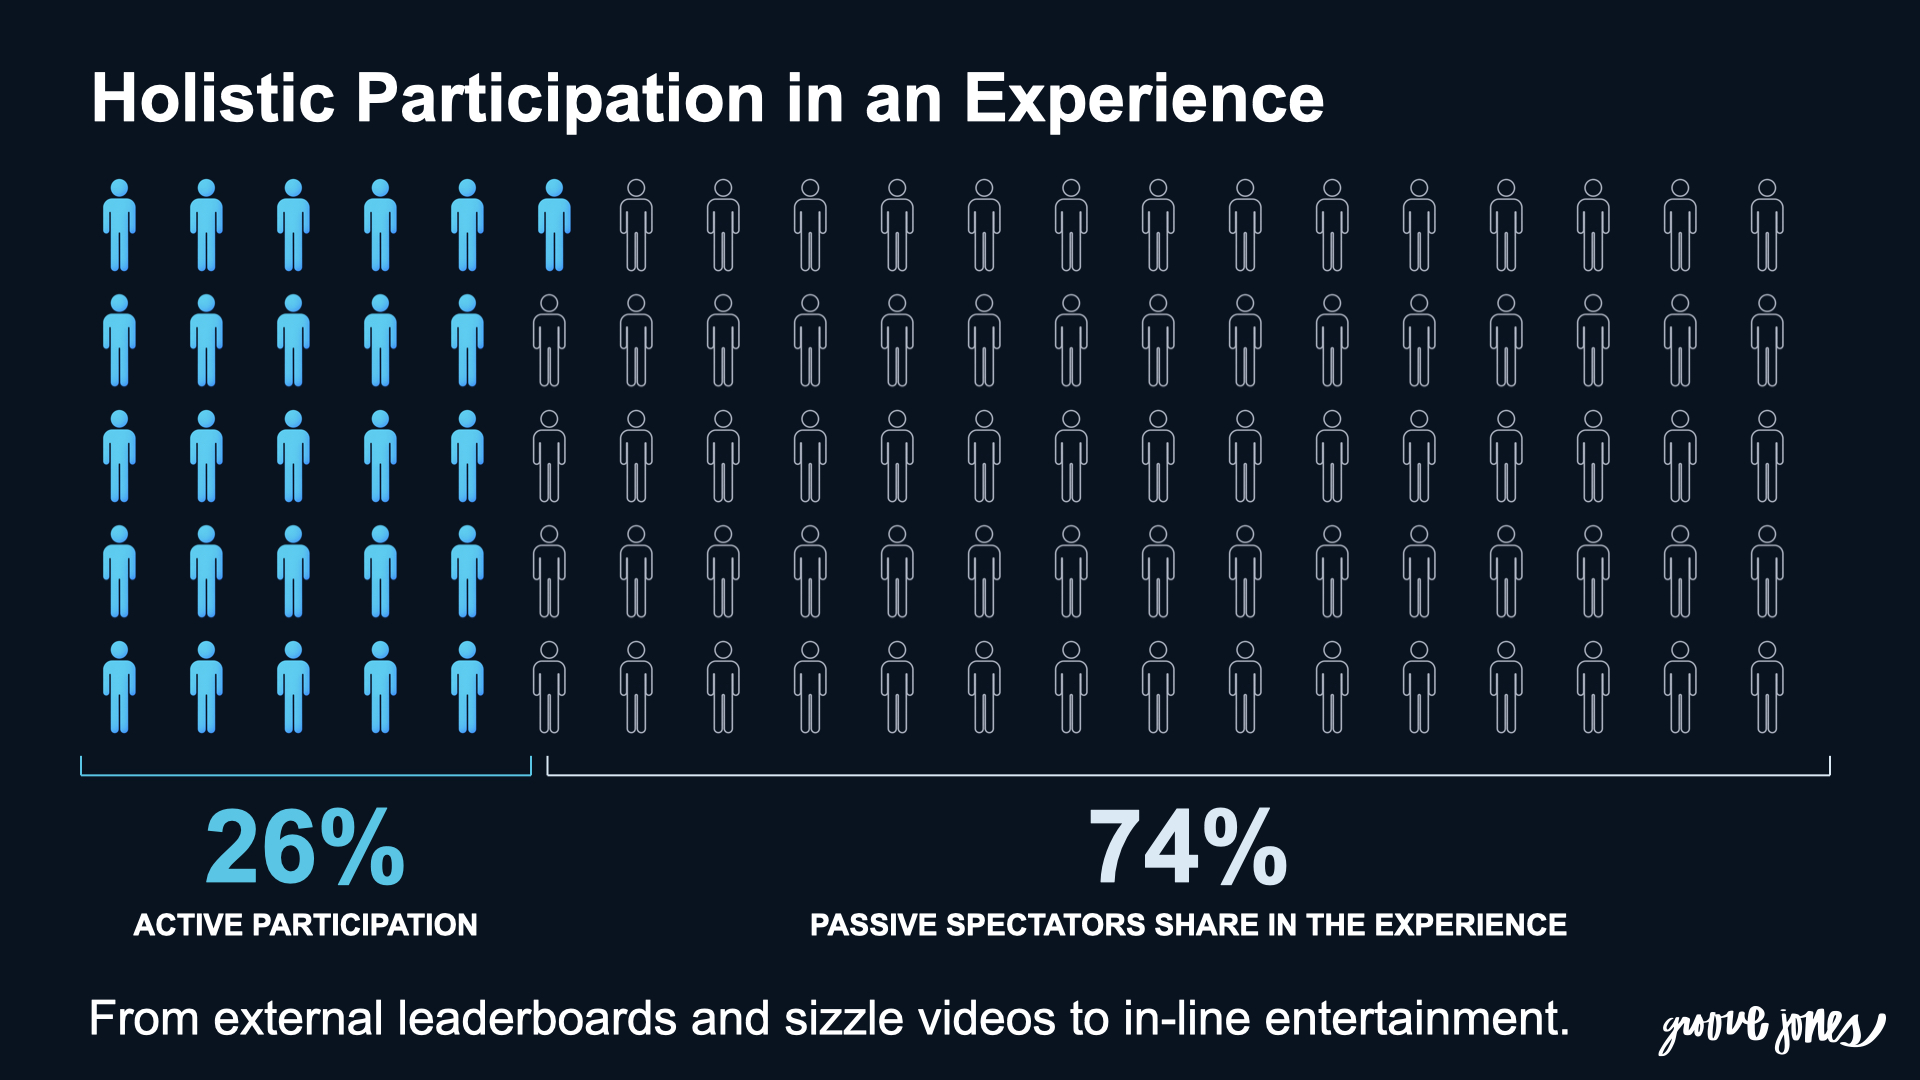
- Engagement. How many people actively participated rather than merely passed by. Plays, scans, sessions started. Modelo’s UFC challenge drew 5,229 players; Sleep Number’s Quarterback Challenge drew 5,584. This is the first number that proves the experience earned a choice, not just an eyeball.
- Dwell. How long people stayed engaged. Time is the clearest signal of genuine interest, and it compounds: Modelo’s tour accumulated 15,687 hours of people actively engaging with the brand. That is a media weight no static asset delivers, and it is directly countable.
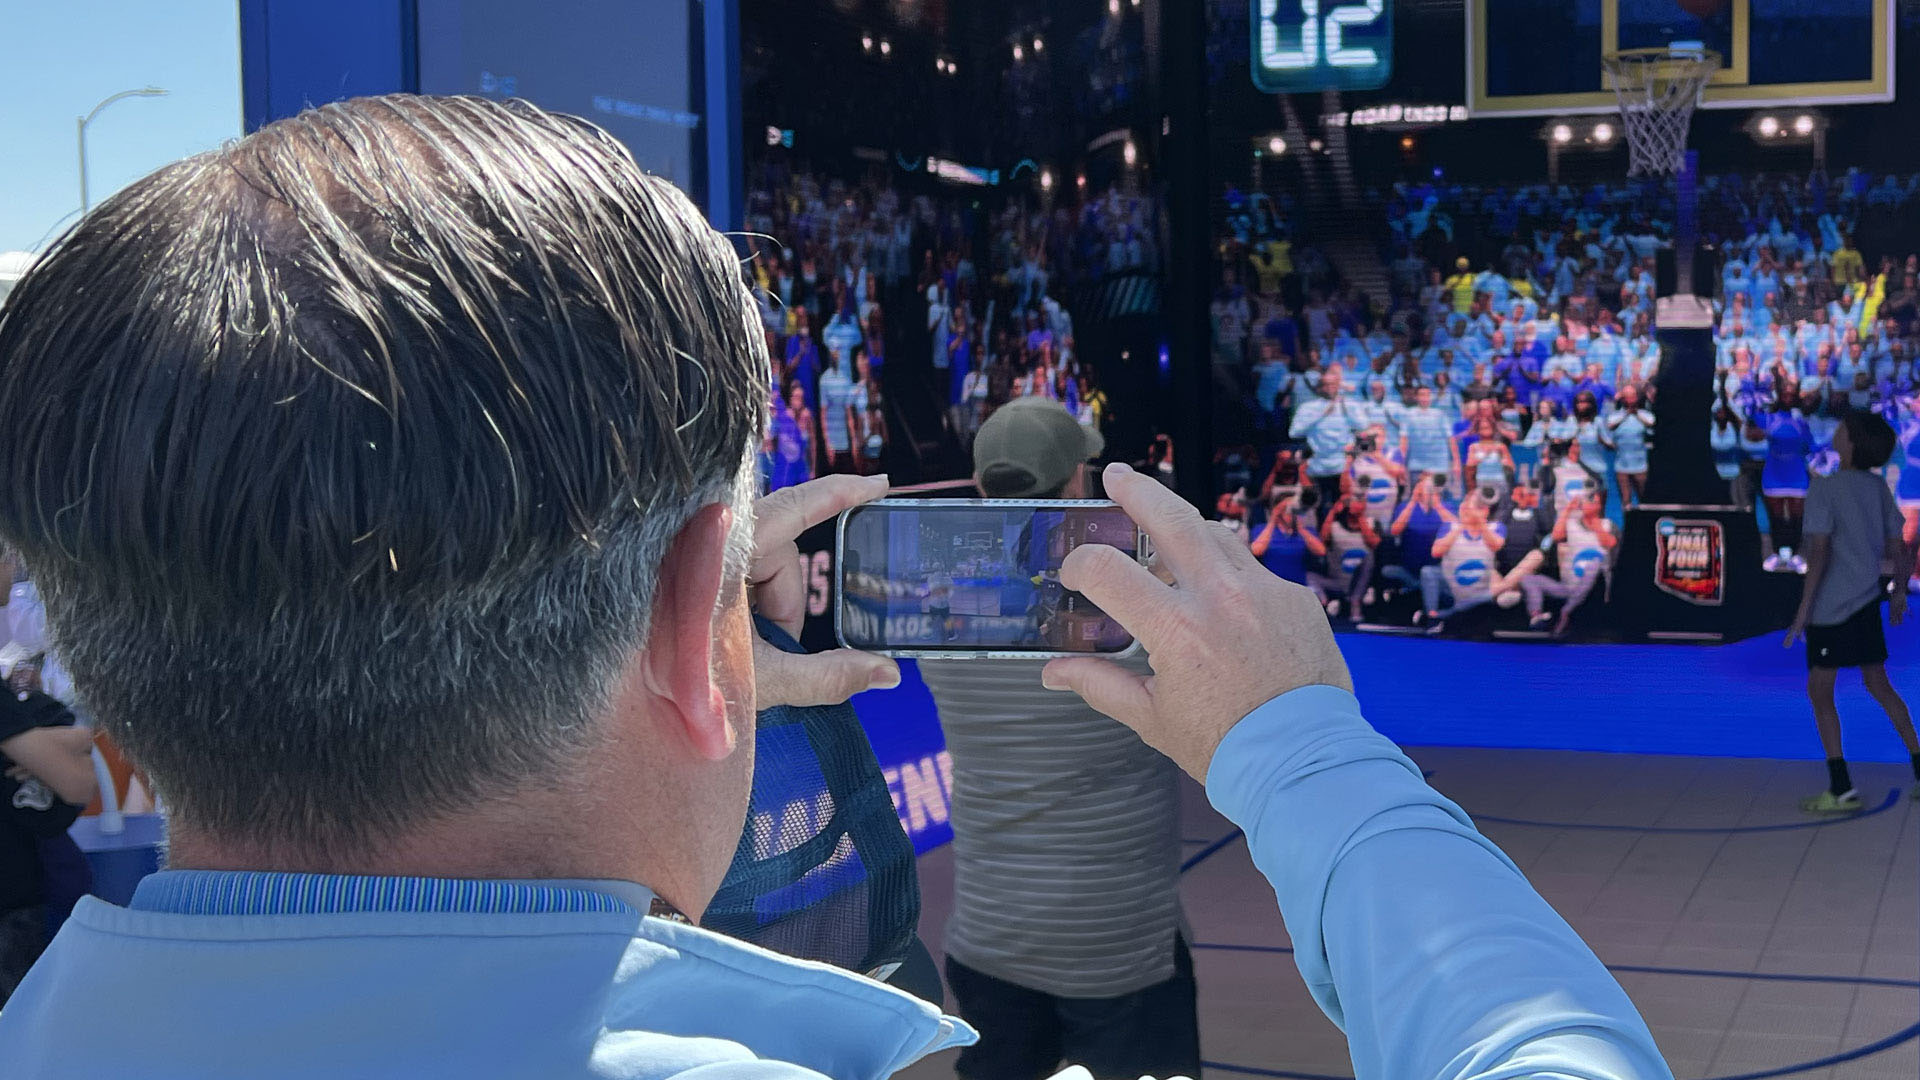
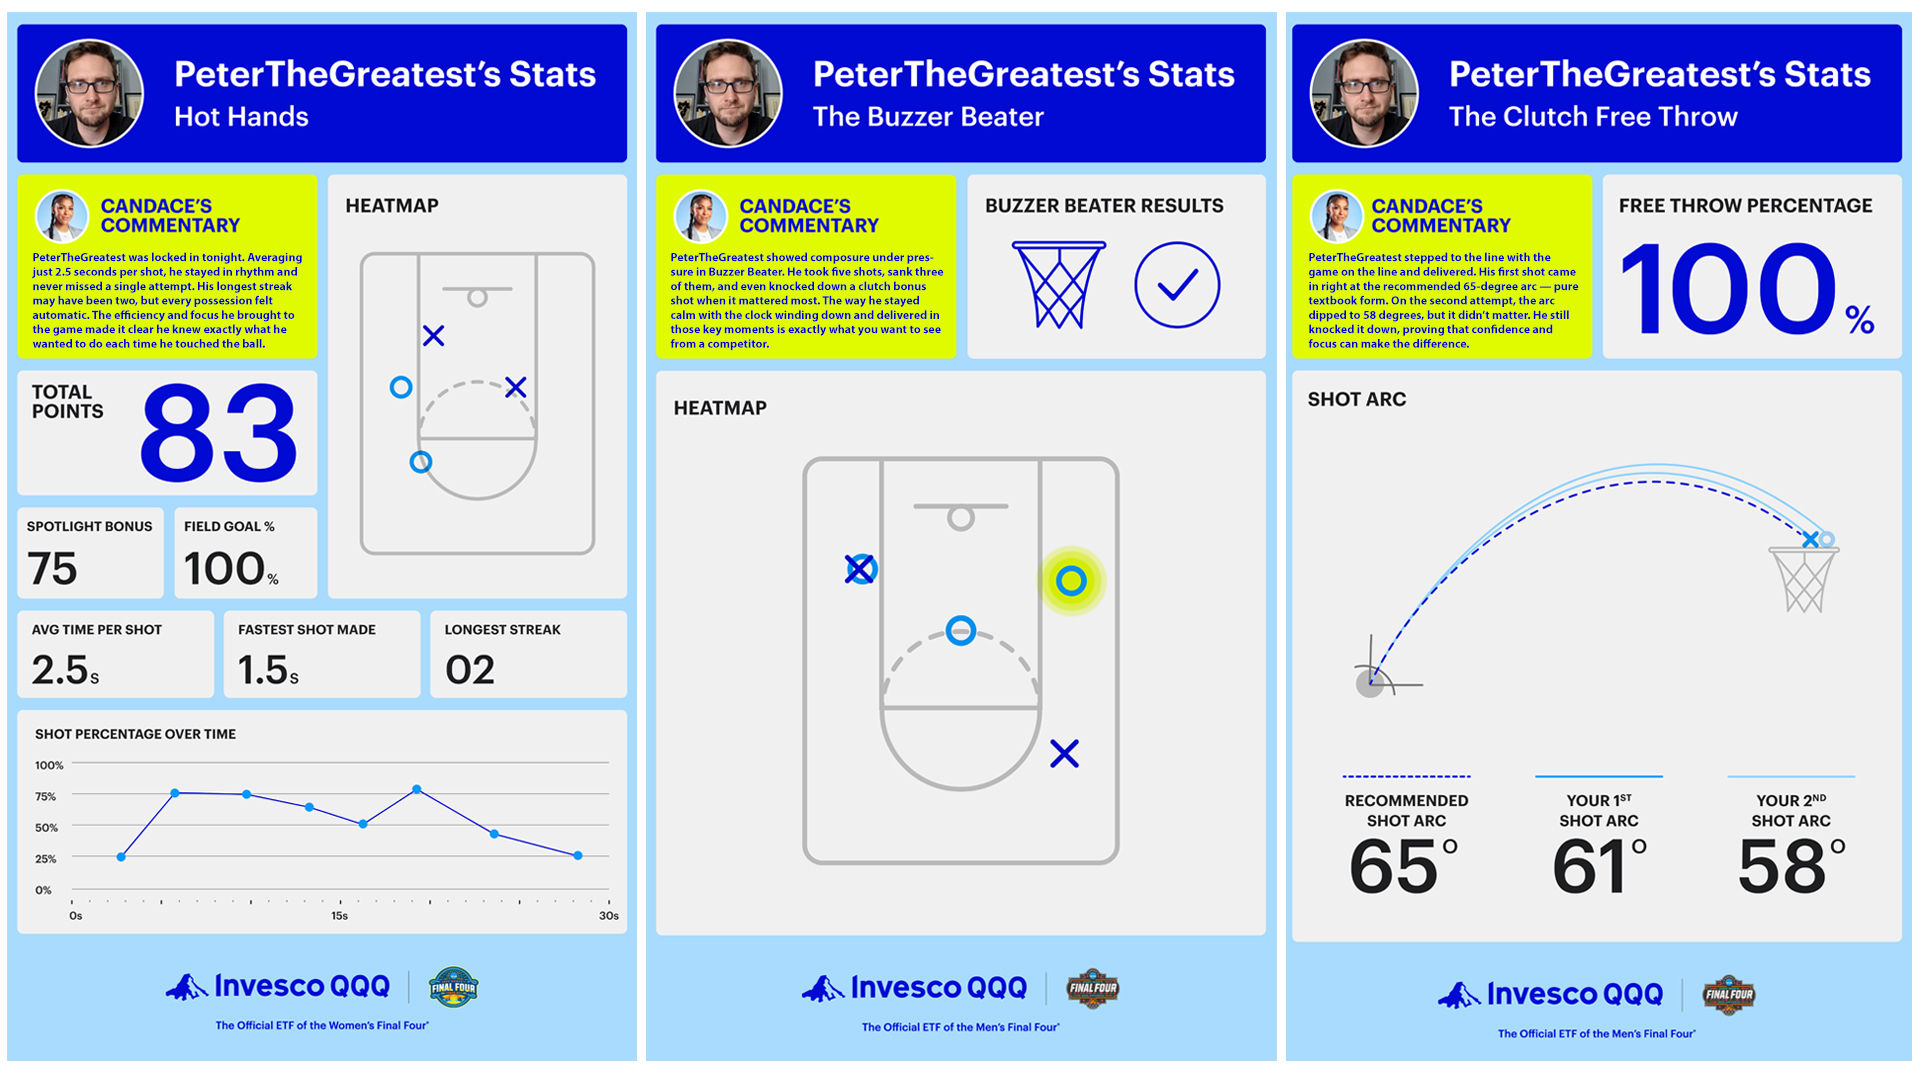
- Spatial interaction. What people did inside the experience. This is the layer most brands leave on the table. With computer vision, Groove Jones instrumented Invesco QQQ’s NCAA Innovation Arena to capture shot locations, generate heatmaps, analyze ball trajectory, and produce a per-player scoring breakdown. Spatial data turns “they engaged” into “here is exactly how,” which is where product and creative insight lives.
- Conversion. The business action the whole thing was built to drive. Sleep Number’s activation captured 10,779 opted-in leads for new customers, integrated directly with the official NFL Fan Mobile Pass. This is the number that ends the budget conversation.
- Earned media. The amplification the experience earned beyond the footprint: coverage, shares, and the social content participants create themselves. It belongs at both ends of the stack, because it widens reach and it validates that the moment was worth talking about.
No single number tells the story. The stack does, because it traces a line from how many people saw it all the way down to how many did the thing you cared about.
Instrument for data capture from day one
Here is the principle that separates measurable activations from memorable-but-unprovable ones: the capture mechanism is part of the creative, and it has to be designed in from the start.
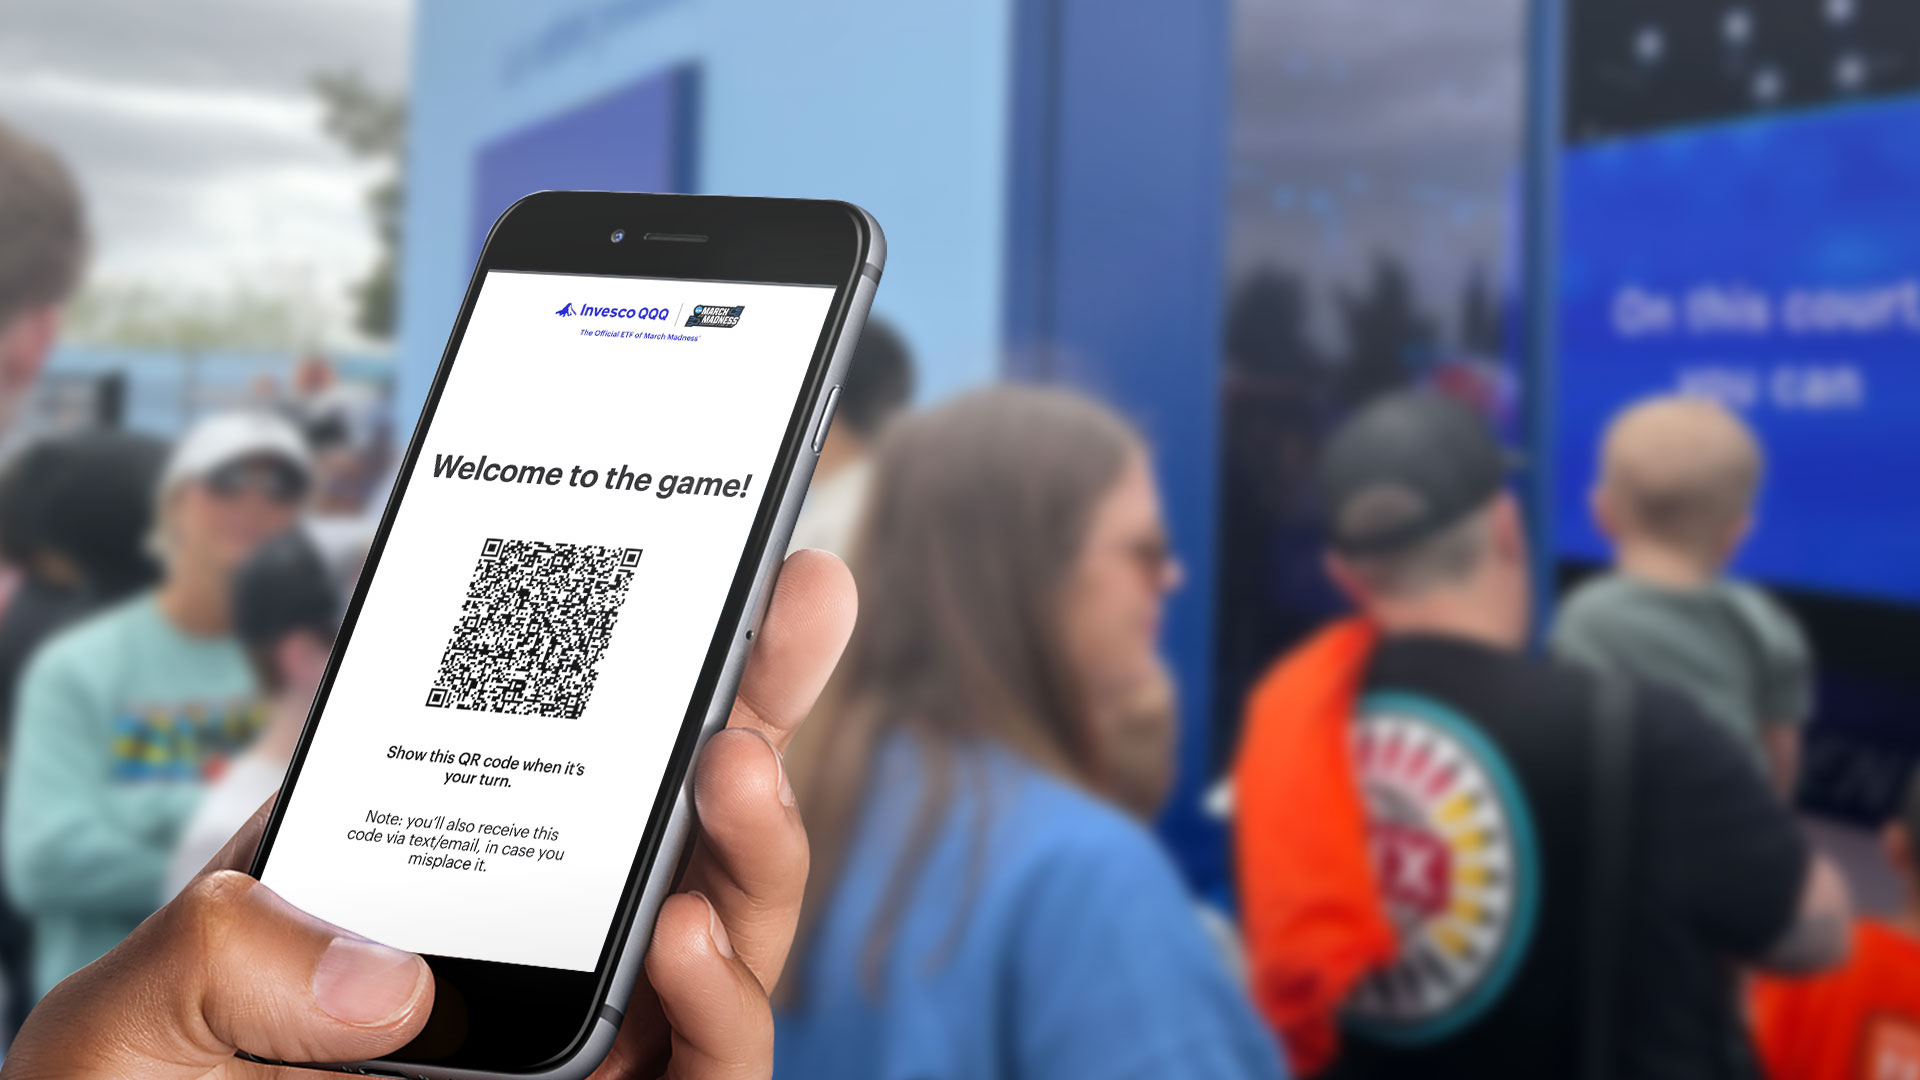
Registration is the foundation. Invesco’s arena asked players to register before they played, which fed the leaderboard and the AI announcer and, not incidentally, created a clean record of participation. Modelo’s brand ambassadors ran a Customer Acquisition App on an iPad that collected consumer data and set up the social share. Sleep Number built a lead-generation app and wired it into the NFL Fan Pass so that opting in also entered fans to win Super Bowl tickets, which is what turned a game into 10,779 leads.
Spatial analytics has to be built in too. The heatmaps and trajectory data from the Invesco arena existed because the computer vision system was designed to capture them, not because someone reviewed footage afterward. If you want to know where people looked, moved, and lingered, the instrumentation is an engineering requirement in the brief, not a report you commission later.
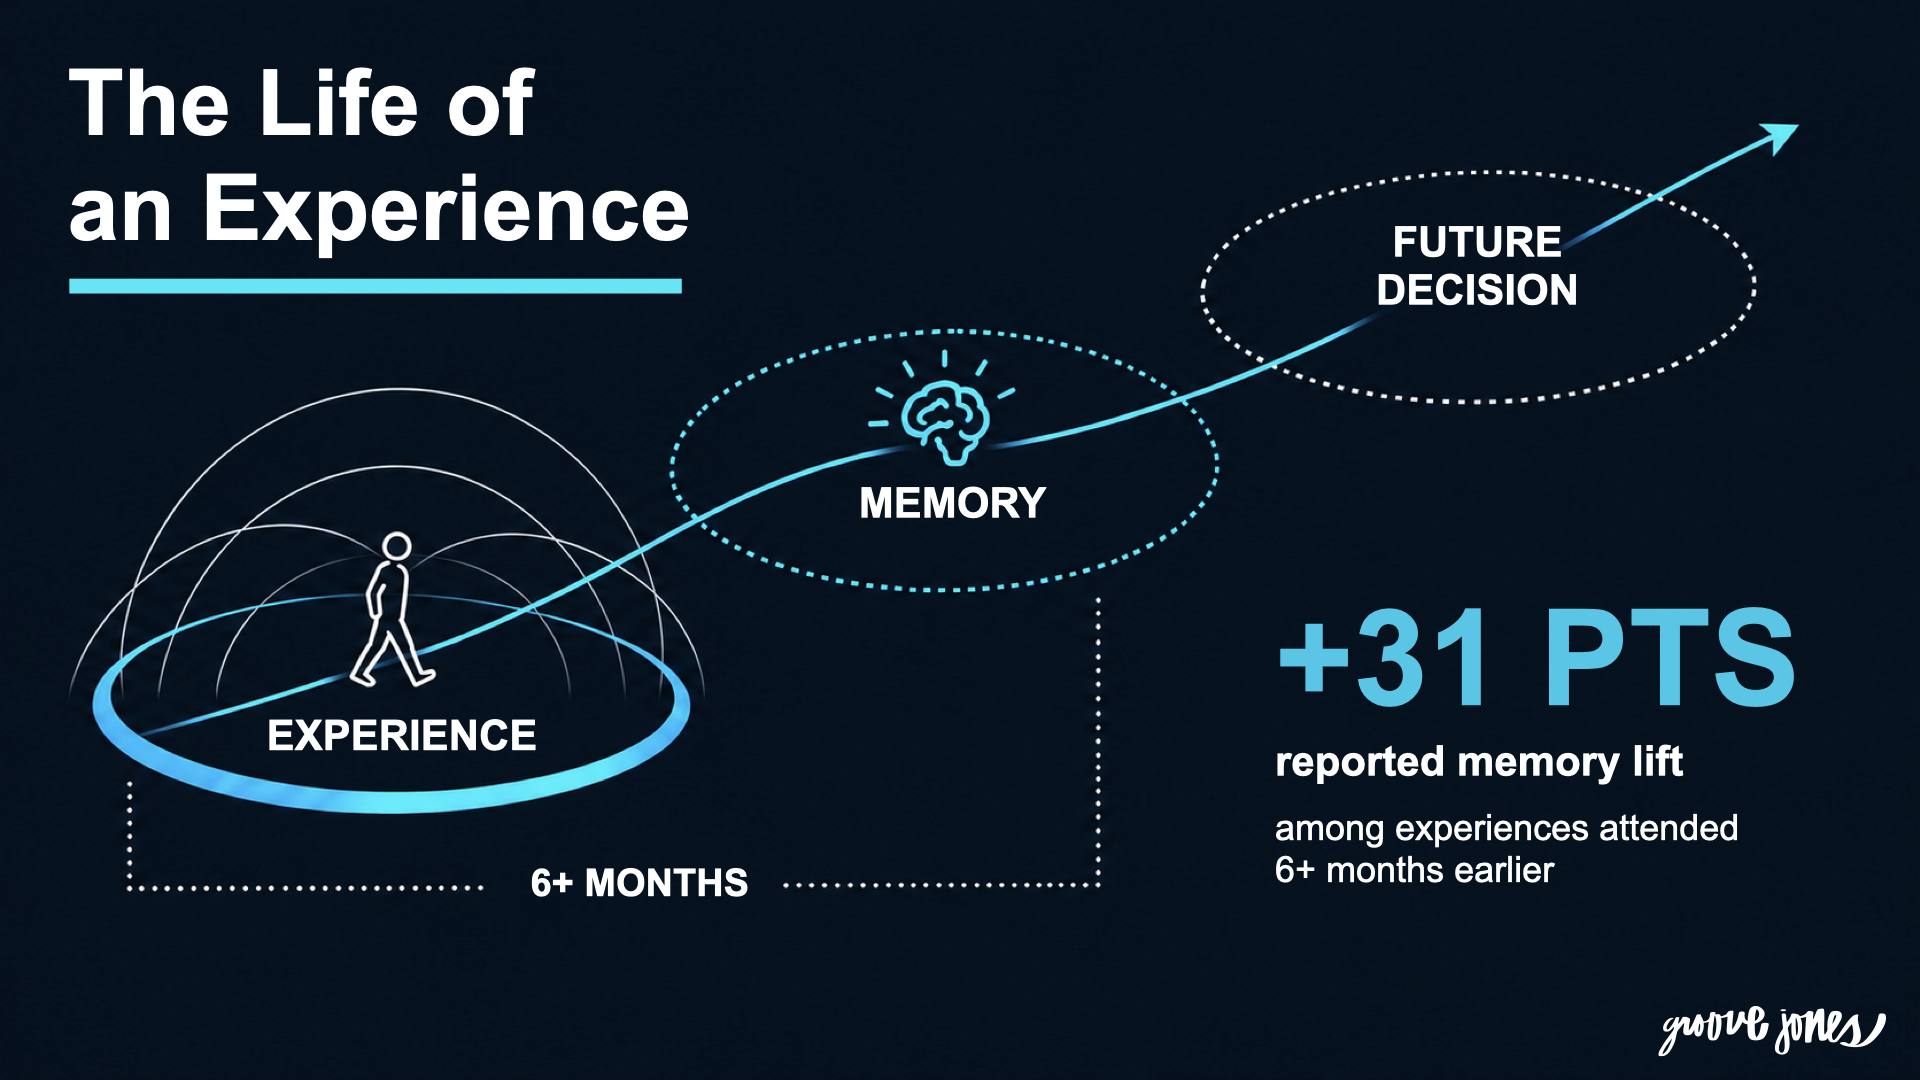
Social sharing is a measurement channel, not just a nicety. When the Invesco arena produced an AI-directed highlight video for each player and delivered it to share, every share became a trackable unit of earned reach. Designing the share pipeline up front means you can count what it produces.

The rule of thumb: if a metric matters at the budget review, the mechanism that captures it has to be in the build. Retrofitting is expensive, lossy, and usually impossible.
Turn experience data into first-party audience insight
The most undervalued output of an immersive activation is not the impressions. It is the first-party data, which is worth more every year as third-party tracking erodes.

An instrumented experience is an audience engine. Opt-in leads flow into a CRM and become a nurturable list, as Sleep Number’s 10,779 did. Registration and performance data enable personalization: Invesco’s 2025 arena returned individualized scorecards to each player, turning raw gameplay into a tailored takeaway that also deepened the brand connection. Aggregate spatial data reveals what actually drew people, which informs the next activation, the retail layout, or the product story.
Two disciplines make this real. First, decide the data model before the build, so you capture clean, structured, consented data rather than a pile you cannot use. Second, treat consent and privacy as design constraints from the outset; the value of first-party data depends entirely on having gathered it properly.
A measured outcome: Sleep Number at the Super Bowl
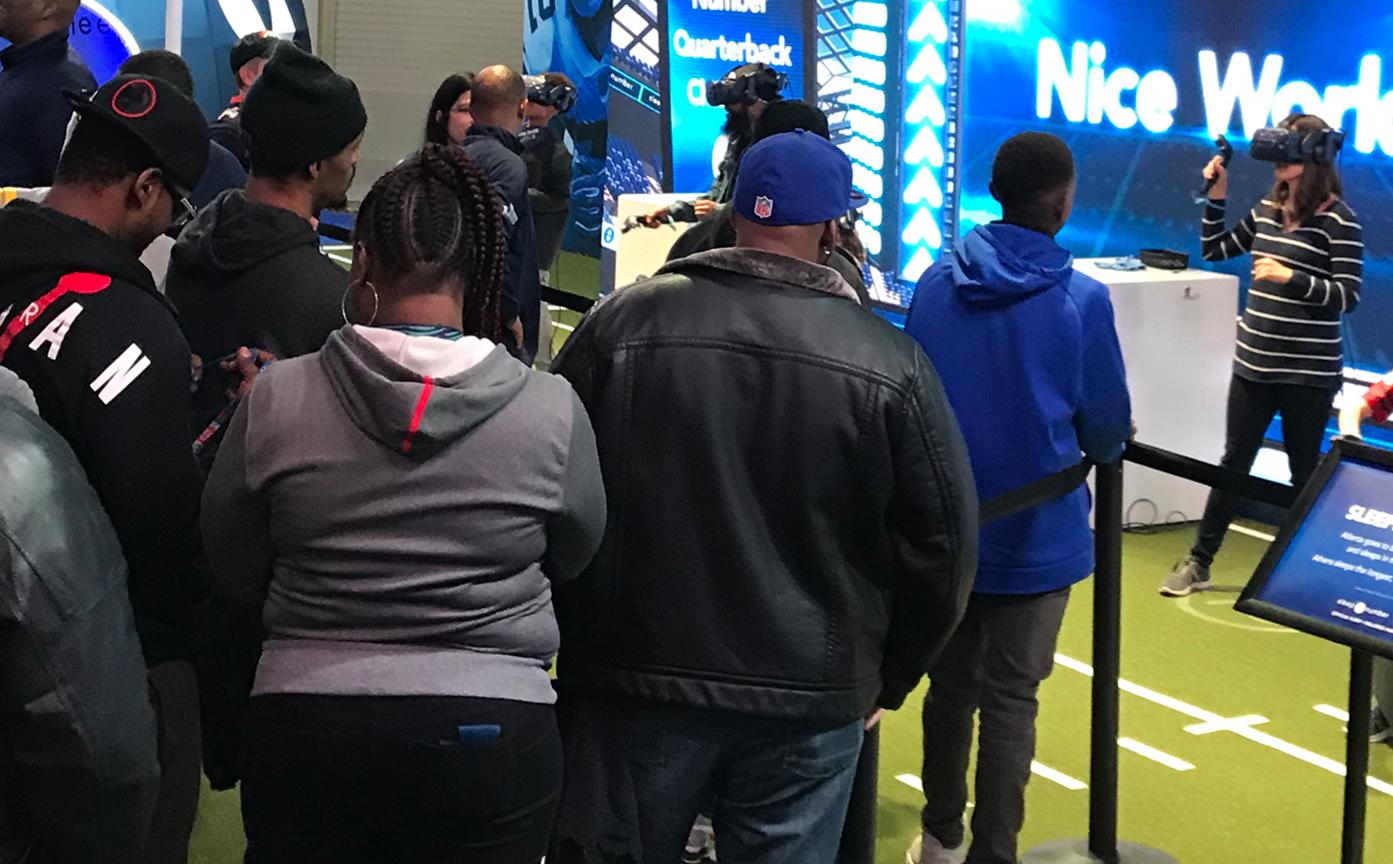
Sleep Number wanted more than a photo op at Super Bowl LII. The activation, a multiplayer VR Quarterback Challenge on a virtual 50-yard line, was engineered to move a business metric and to prove it. The gameplay itself carried the brand message: the first half had you throwing passes well-rested and sharp, the second half simulated the drop-off of a poor night’s sleep, making the product benefit something fans felt rather than read. Throughput was designed for crowds, averaging eight players every ninety seconds, and a lead-generation app was integrated with the NFL Fan Mobile Pass so that participation and opt-in were the same motion.
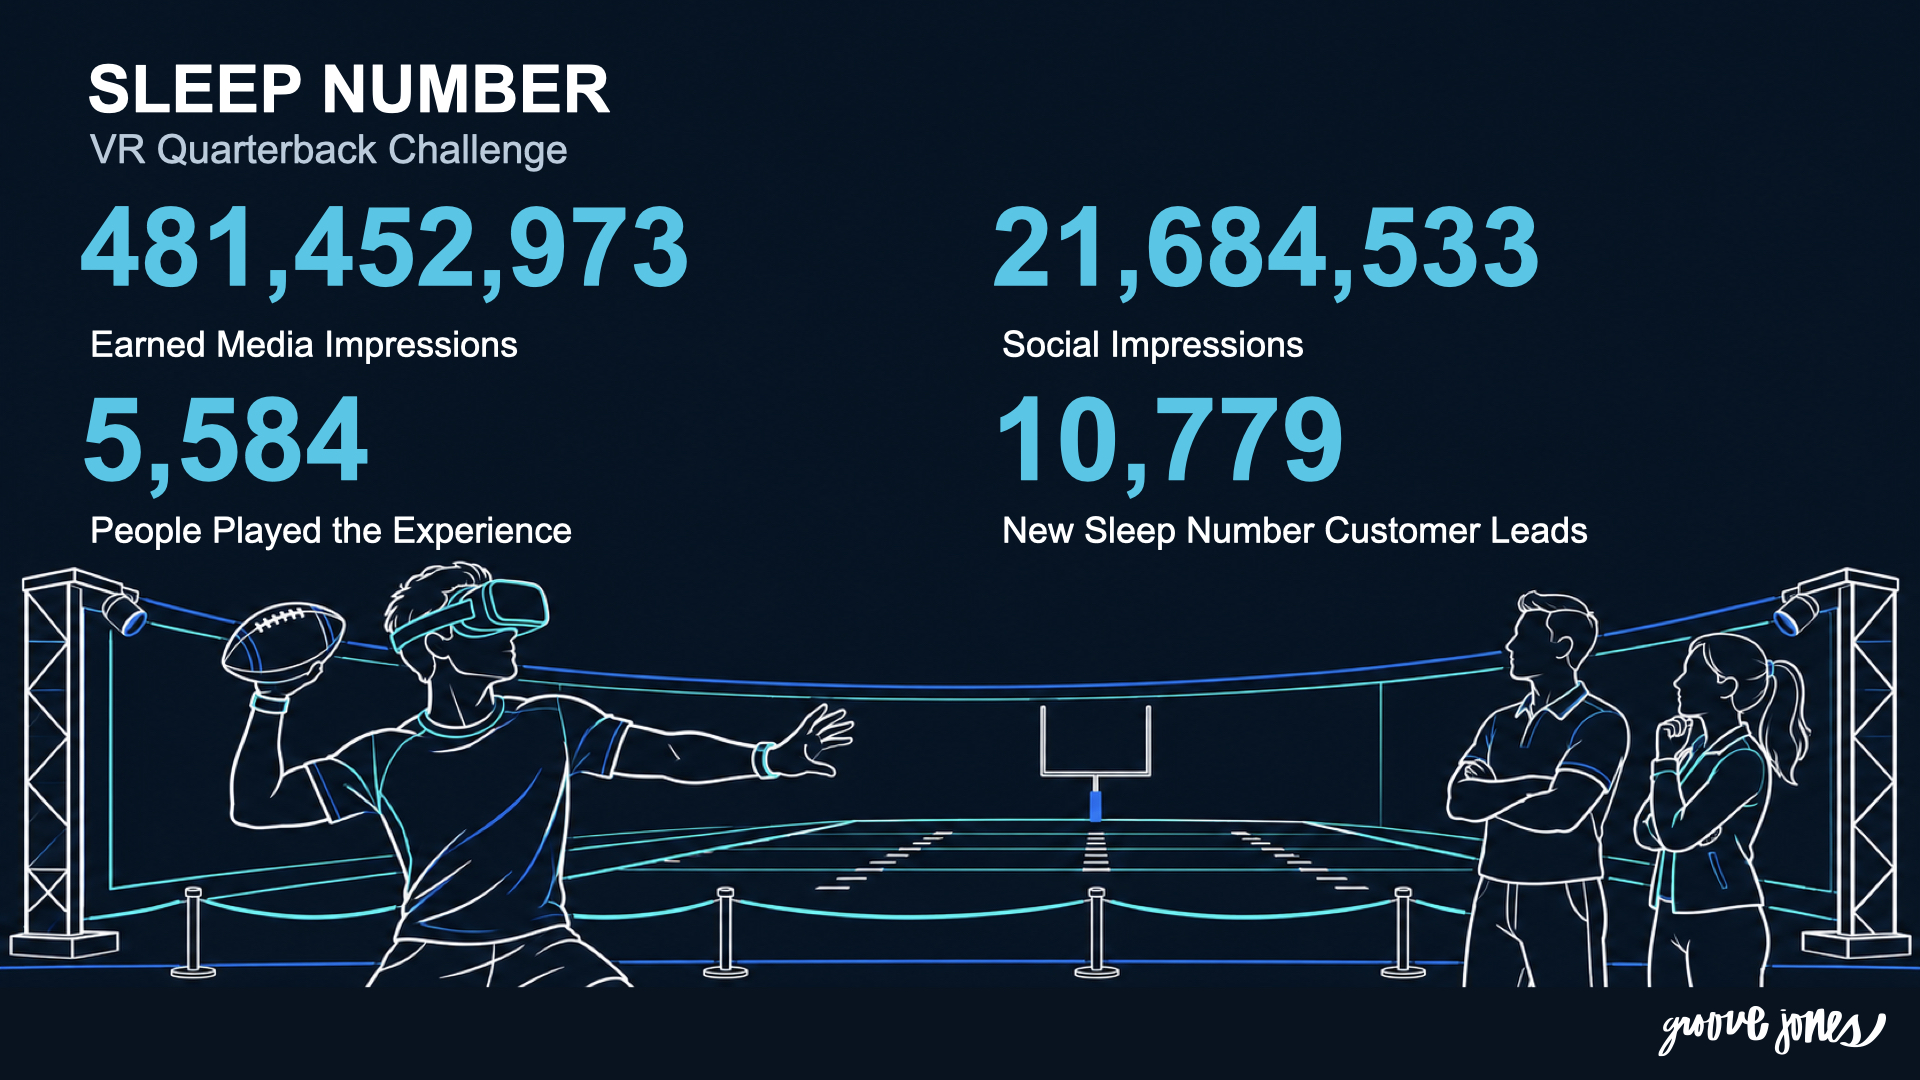
The results told a complete story up and down the stack: 481,452,973 earned media impressions, 21,684,533 social impressions, 5,584 people who played, and 10,779 leads on new customers. The work took top honors as ICX Deployment of the Year and won an Event Marketer Gold EX Award for Best Use of Technology and Social. It performed because the measurement was not an afterthought; it was built into the concept, the tech, and the fan’s path through the experience.
Modelo’s UFC tour and Invesco’s NCAA arena prove the same point from different angles: 525 events and 15,687 engagement-hours in one case, and rich spatial heatmaps and personalized scorecards in the other, all because the capture was designed in.
The takeaway
Immersive is not hard to measure. It is hard to measure after the fact. Decide the business metric first, build the capture into the experience, respect the data you collect, and you will walk into the budget review with a number instead of a highlight reel.
Use the one-page measurement plan above to scope your next activation, and talk to Groove Jones about instrumenting it so the results are provable from day one.


