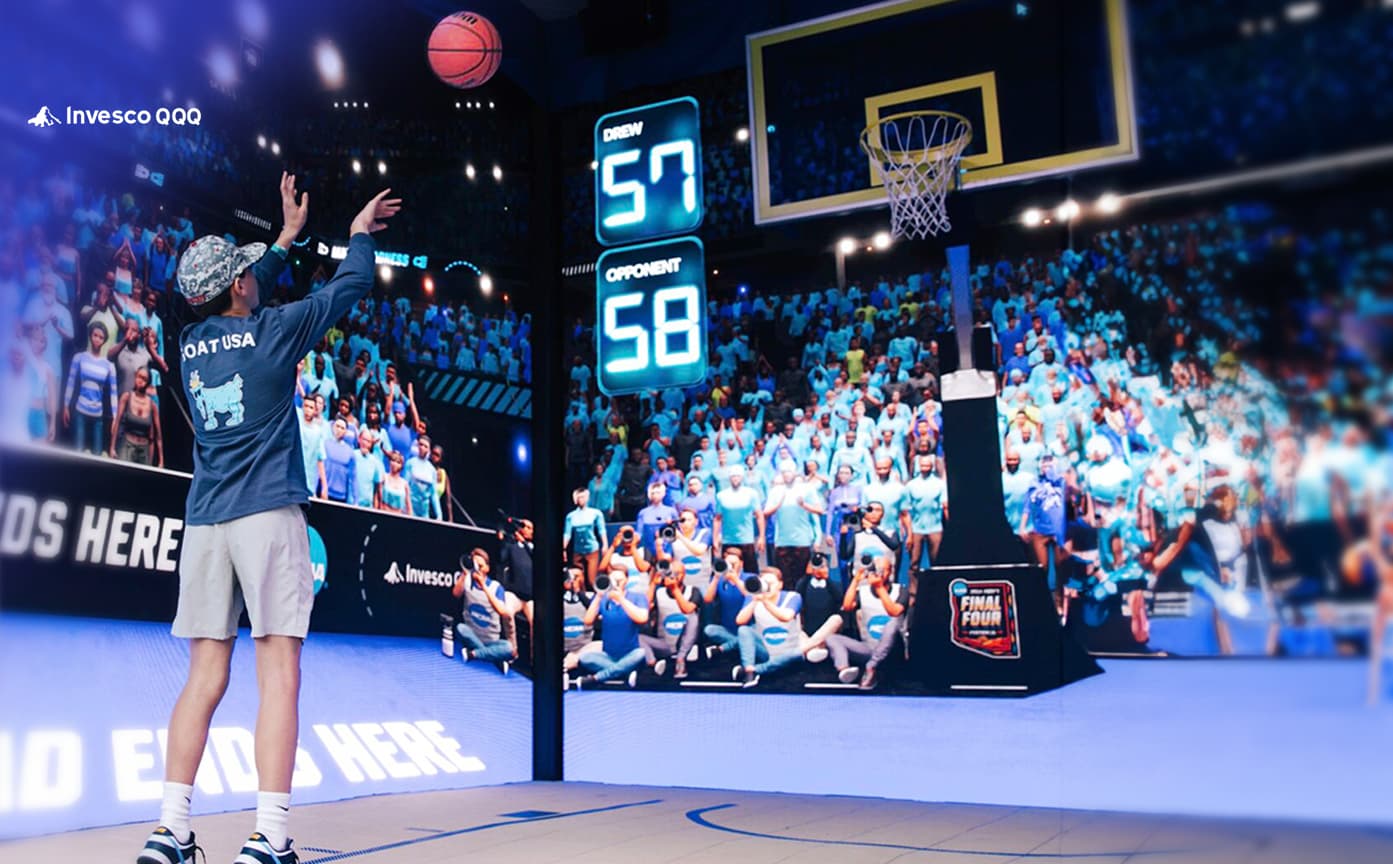




An AI mirror can stop people in their tracks. Guests gather around the screen, laugh at their transformations, record videos, and invite friends to try it next. That energy is valuable, but it is not a measurement plan.
For marketers, the real question is what the interaction accomplished. Did it attract the right audience? Did people complete the experience? Did they create content, explore a product, join a loyalty program, or take another meaningful action?
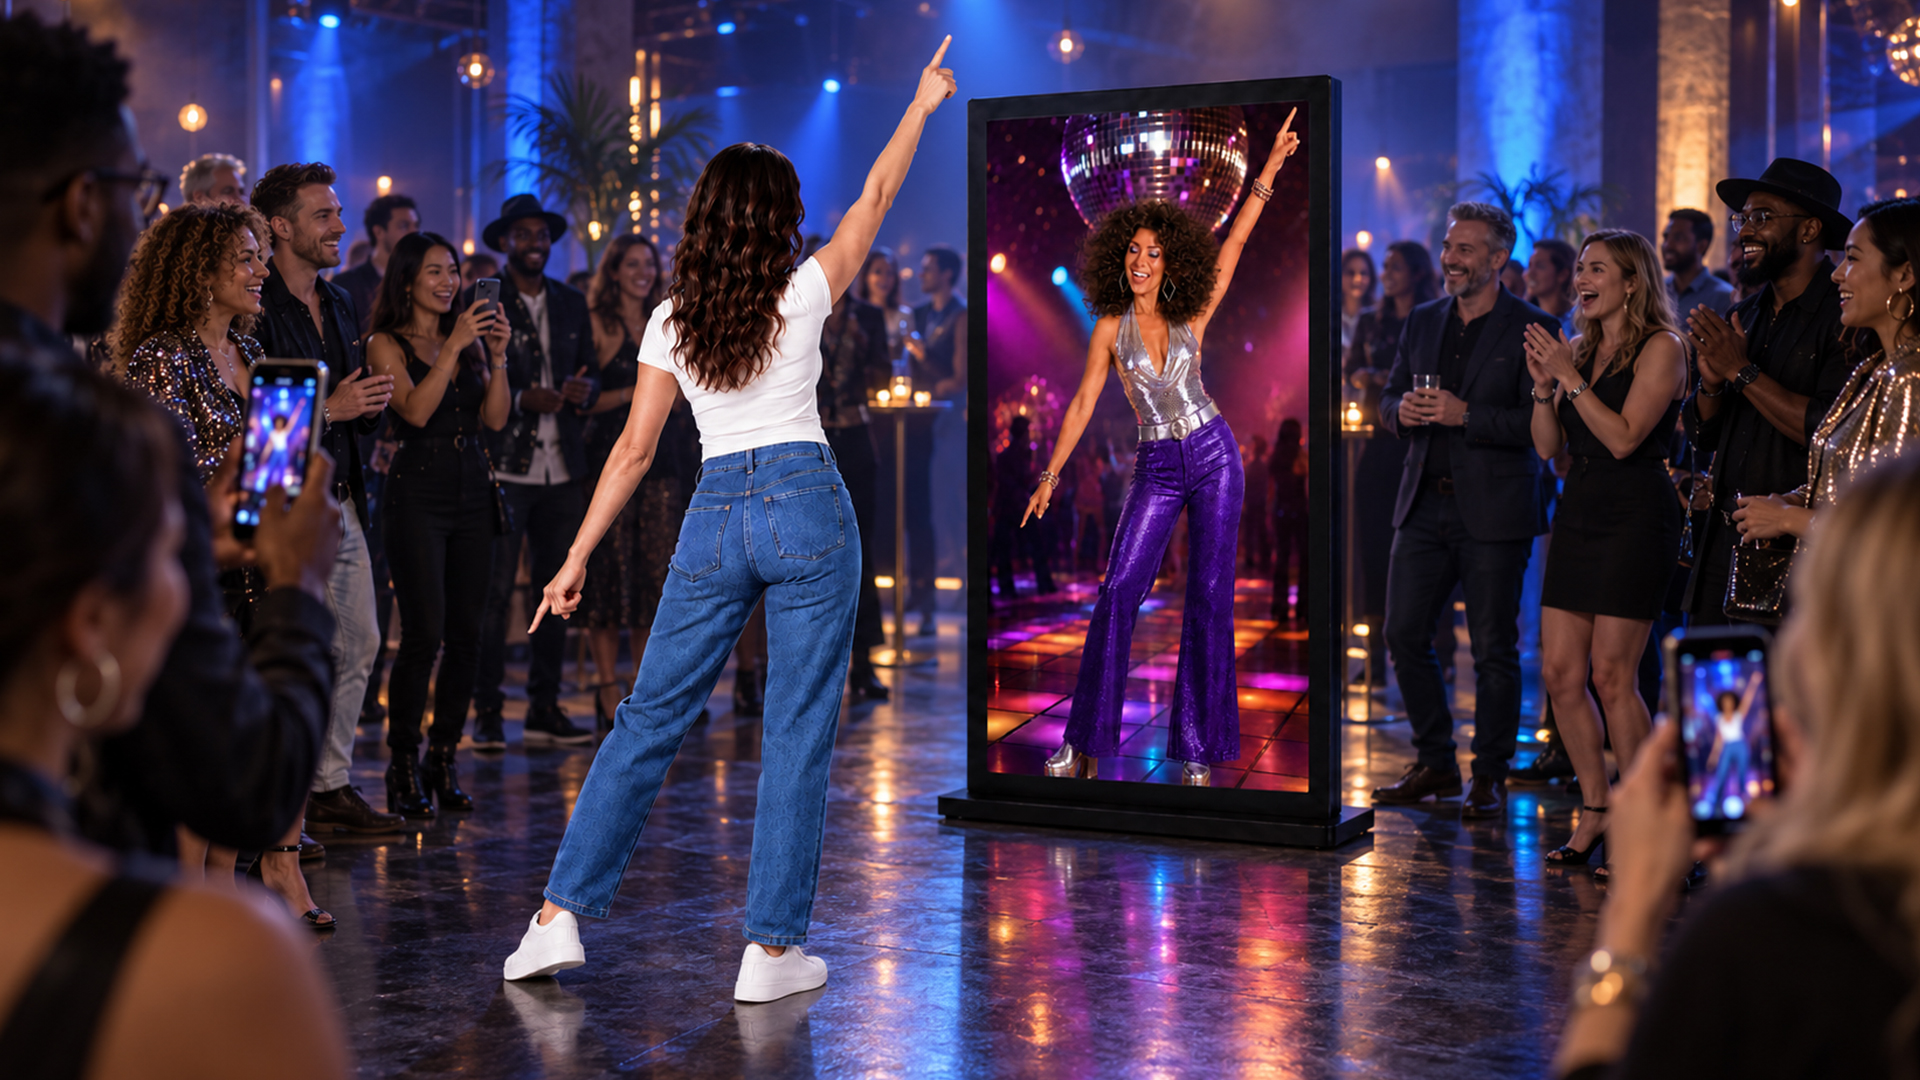
The answers should be defined before the activation opens. When measurement is planned alongside the creative, an AI mirror becomes more than a memorable installation. It becomes a trackable part of the campaign.
Begin With One Primary Objective
AI mirror activations can support many goals, but trying to optimize for all of them at once usually creates a confused experience. Start by choosing the primary job:
- Attract attention and increase foot traffic
- Encourage product or collection exploration
- Create personalized photos or videos
- Increase dwell time at a booth or branded space
- Capture qualified leads or loyalty sign-ups
- Strengthen fan or guest engagement
- Connect an event interaction to a digital journey
Secondary goals can still matter. A retail activation designed to encourage product exploration may also generate shareable content. A fan experience may also collect opt-ins. But the primary objective determines the interaction, the call to action, and the most important measure of success. If the objective is unclear, the reporting will be unclear too.
Measure the Complete Participation Funnel
A single total, such as the number of photos created, tells only part of the story. A more useful approach follows the participant from first exposure through the final action.
Opportunity to See
How many people passed through the area where the activation was visible? This may come from venue attendance, door counts, booth traffic estimates, or another approved source. It is not the same as engagement, but it gives the results context. Two hundred completed sessions mean something different in a private event of 400 people than in a concourse that receives tens of thousands of passersby.
1. Approaches
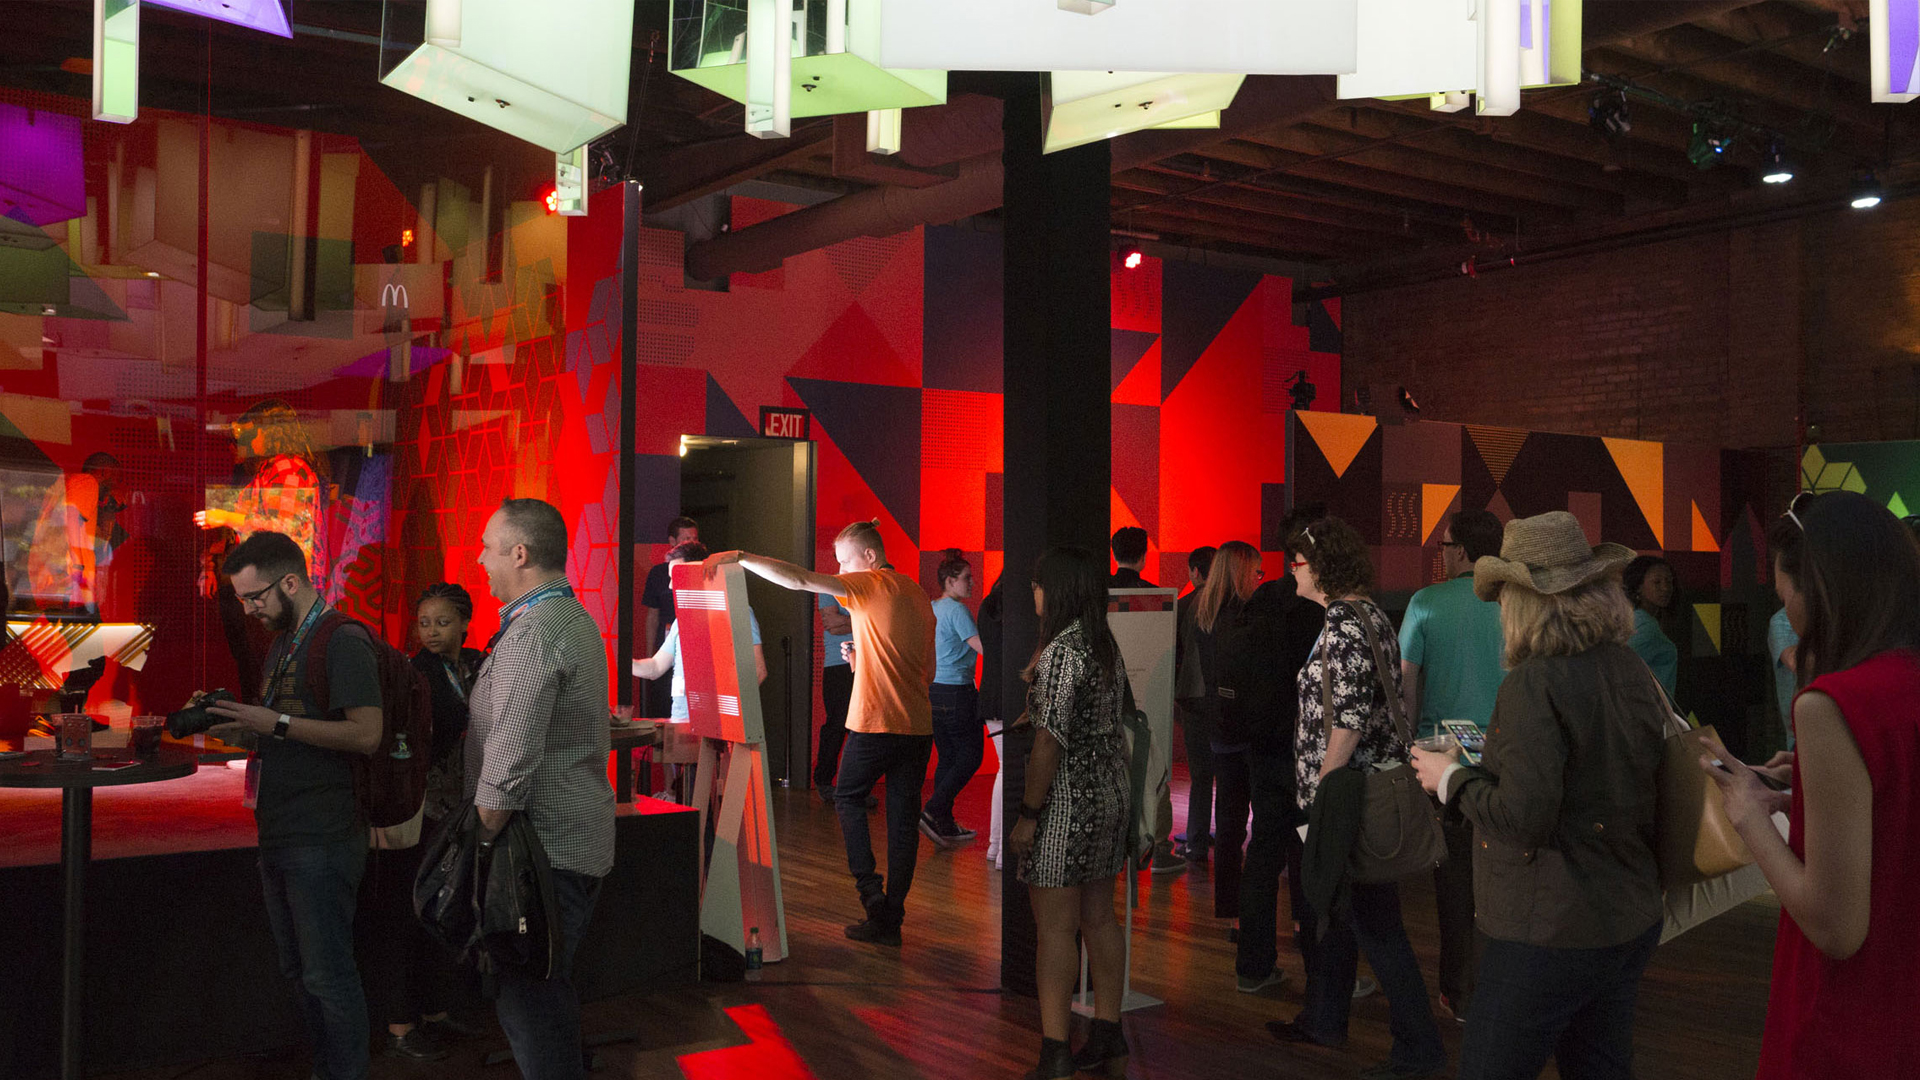
How many people stopped, moved closer, or showed clear interest? This is a measure of how the experience pulled in a crowd. Depending on the installation and privacy plan, approaches may be estimated through observation, staff counts, anonymous sensing, or activation events. The method should be documented so future campaigns can be compared fairly.
2. Starts
How many participants actively began the experience? A start might be a tap, a pose prompt, a style selection, or another clear first action. Comparing starts with approaches can expose friction. People may be curious but unsure what to do, concerned about the line, or unable to understand the payoff quickly.
3. Completions
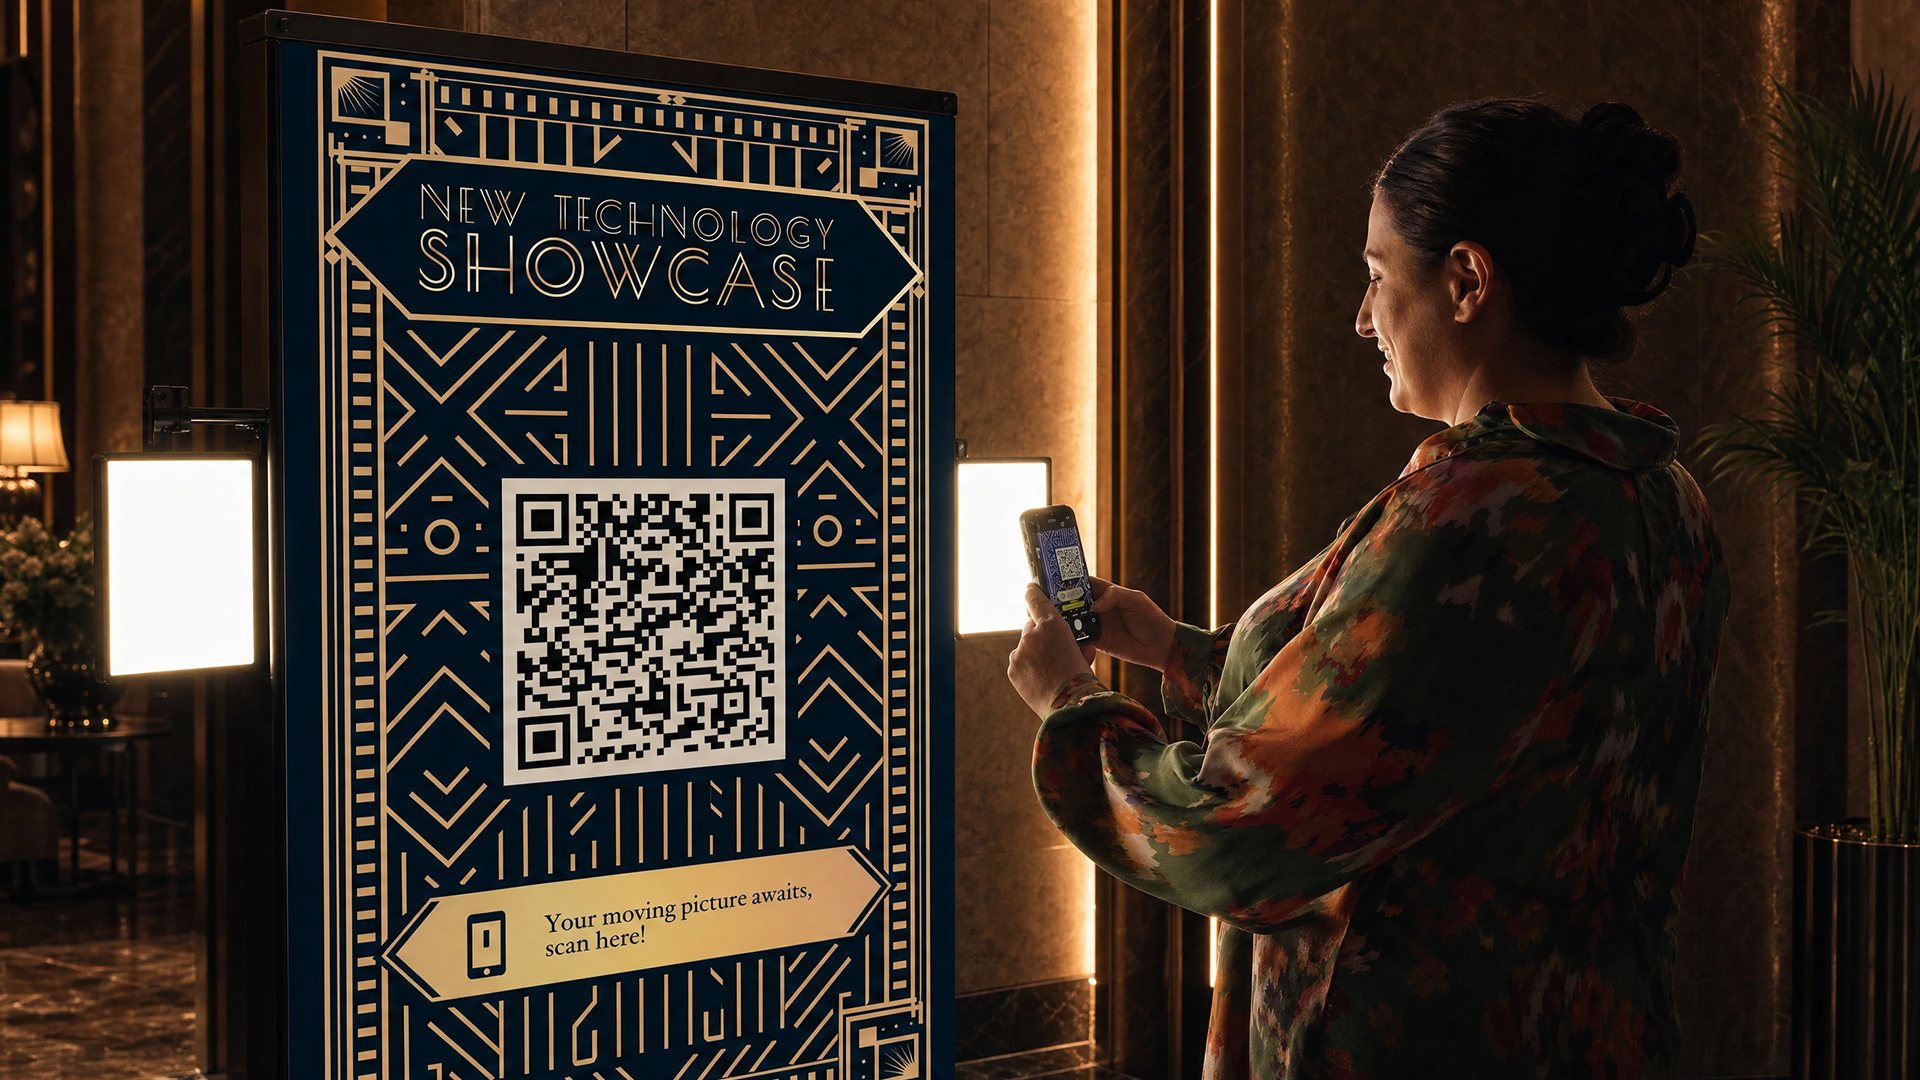
How many people reached the intended finish? Completion could mean trying a look, recording a video, receiving a generated image, or reaching the delivery screen. A low completion rate may indicate that the flow is too long, the instructions are unclear, processing takes too much time, or a technical issue is interrupting sessions.
4. Content Retrieval
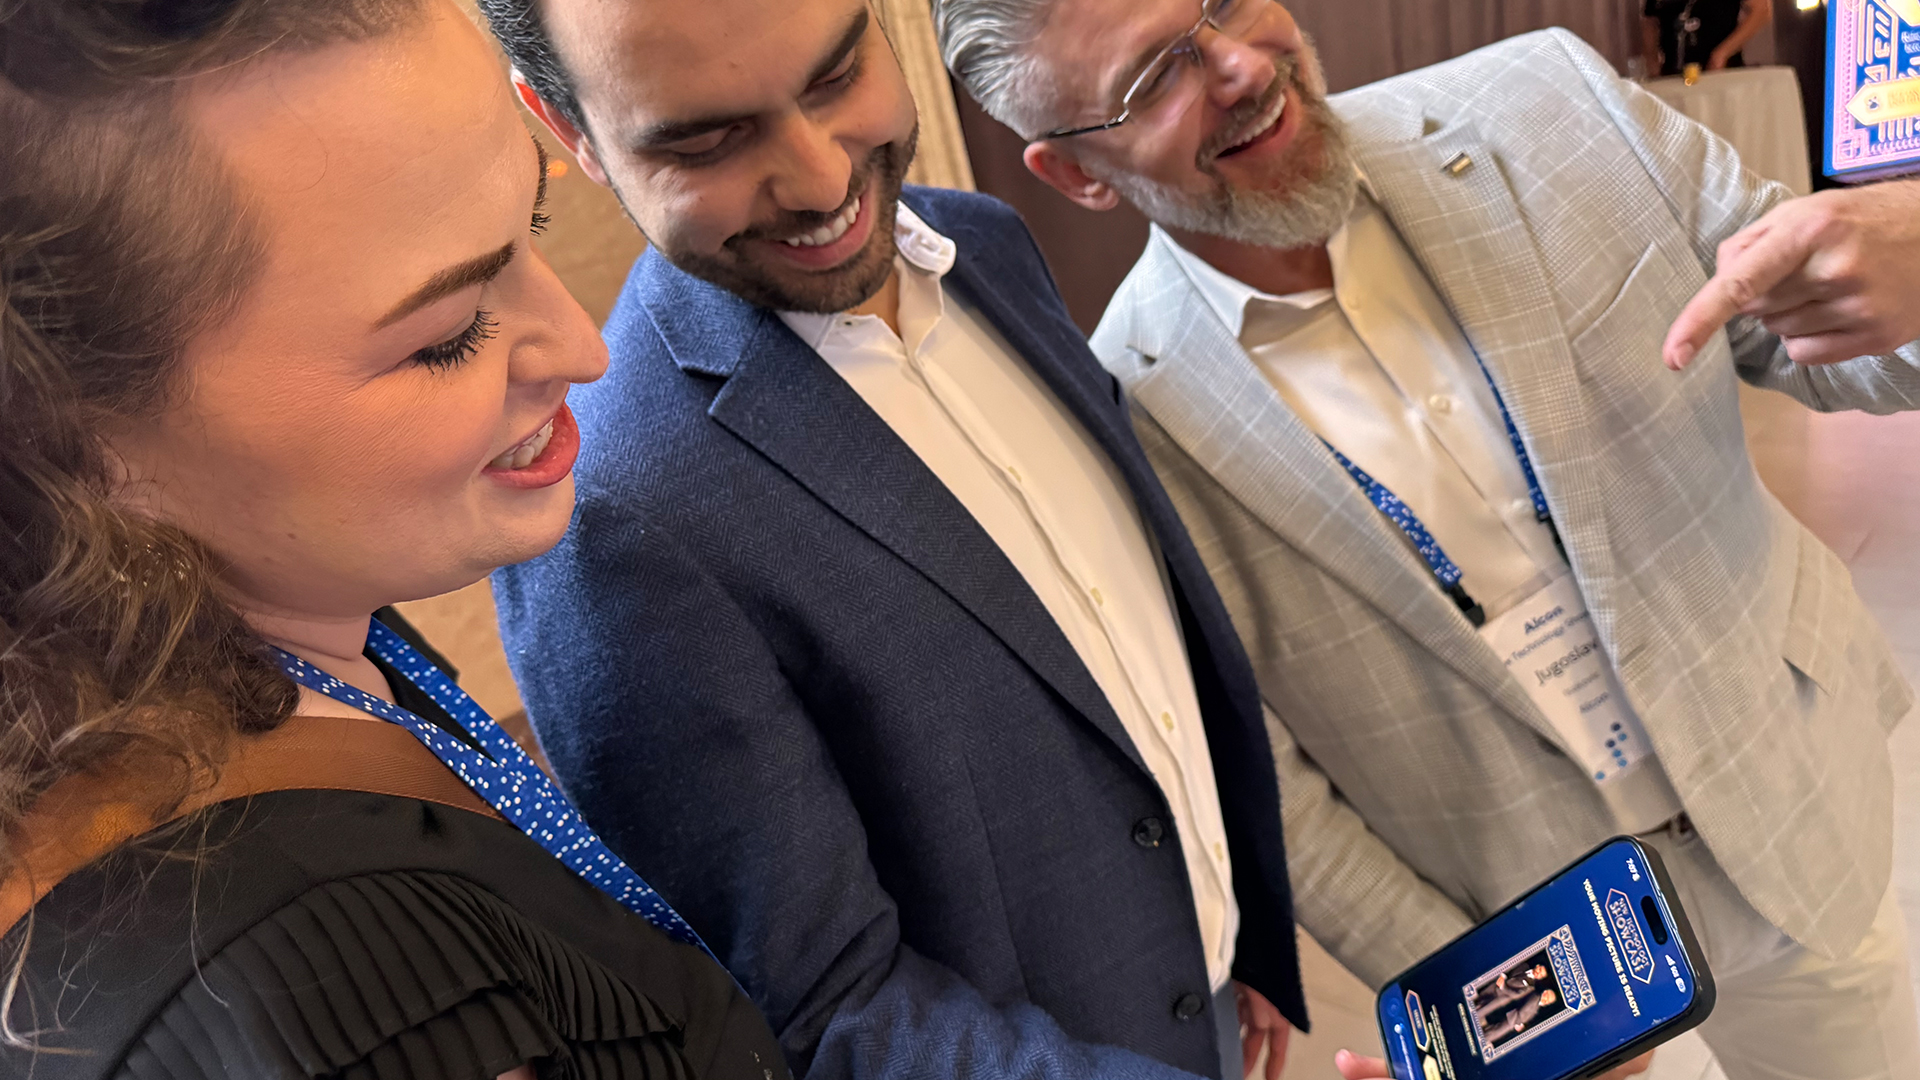
How many participants downloaded, emailed, scanned, or otherwise retrieved their content? This is different from content creation. A file that is generated but never collected has limited value to the participant. The delivery method should be easy to understand and should work with the venue’s actual lighting, connectivity, and traffic.
5. Amplification
How often did participants share, post, or revisit the content? Direct measurement depends on the delivery journey and the permissions available. When social sharing cannot be reliably tracked, report what is known, such as downloads or share-button taps, instead of presenting an estimate as confirmed reach.
6. Next Action
What happened after the experience? Depending on the campaign, the desired action might be viewing a product, joining a program, entering a sweepstakes, visiting another zone, booking a demo, or making a purchase. Use a distinct QR code, landing page, offer, or other approved attribution method when that connection matters.
Add Operational Metrics
Campaign performance is only half of the picture. Live activations also need operational measures. Track average session time, sessions per hour, peak demand, queue length, abandonment, downtime, processing time, and support interventions. These measures help explain the audience results and improve the next deployment.
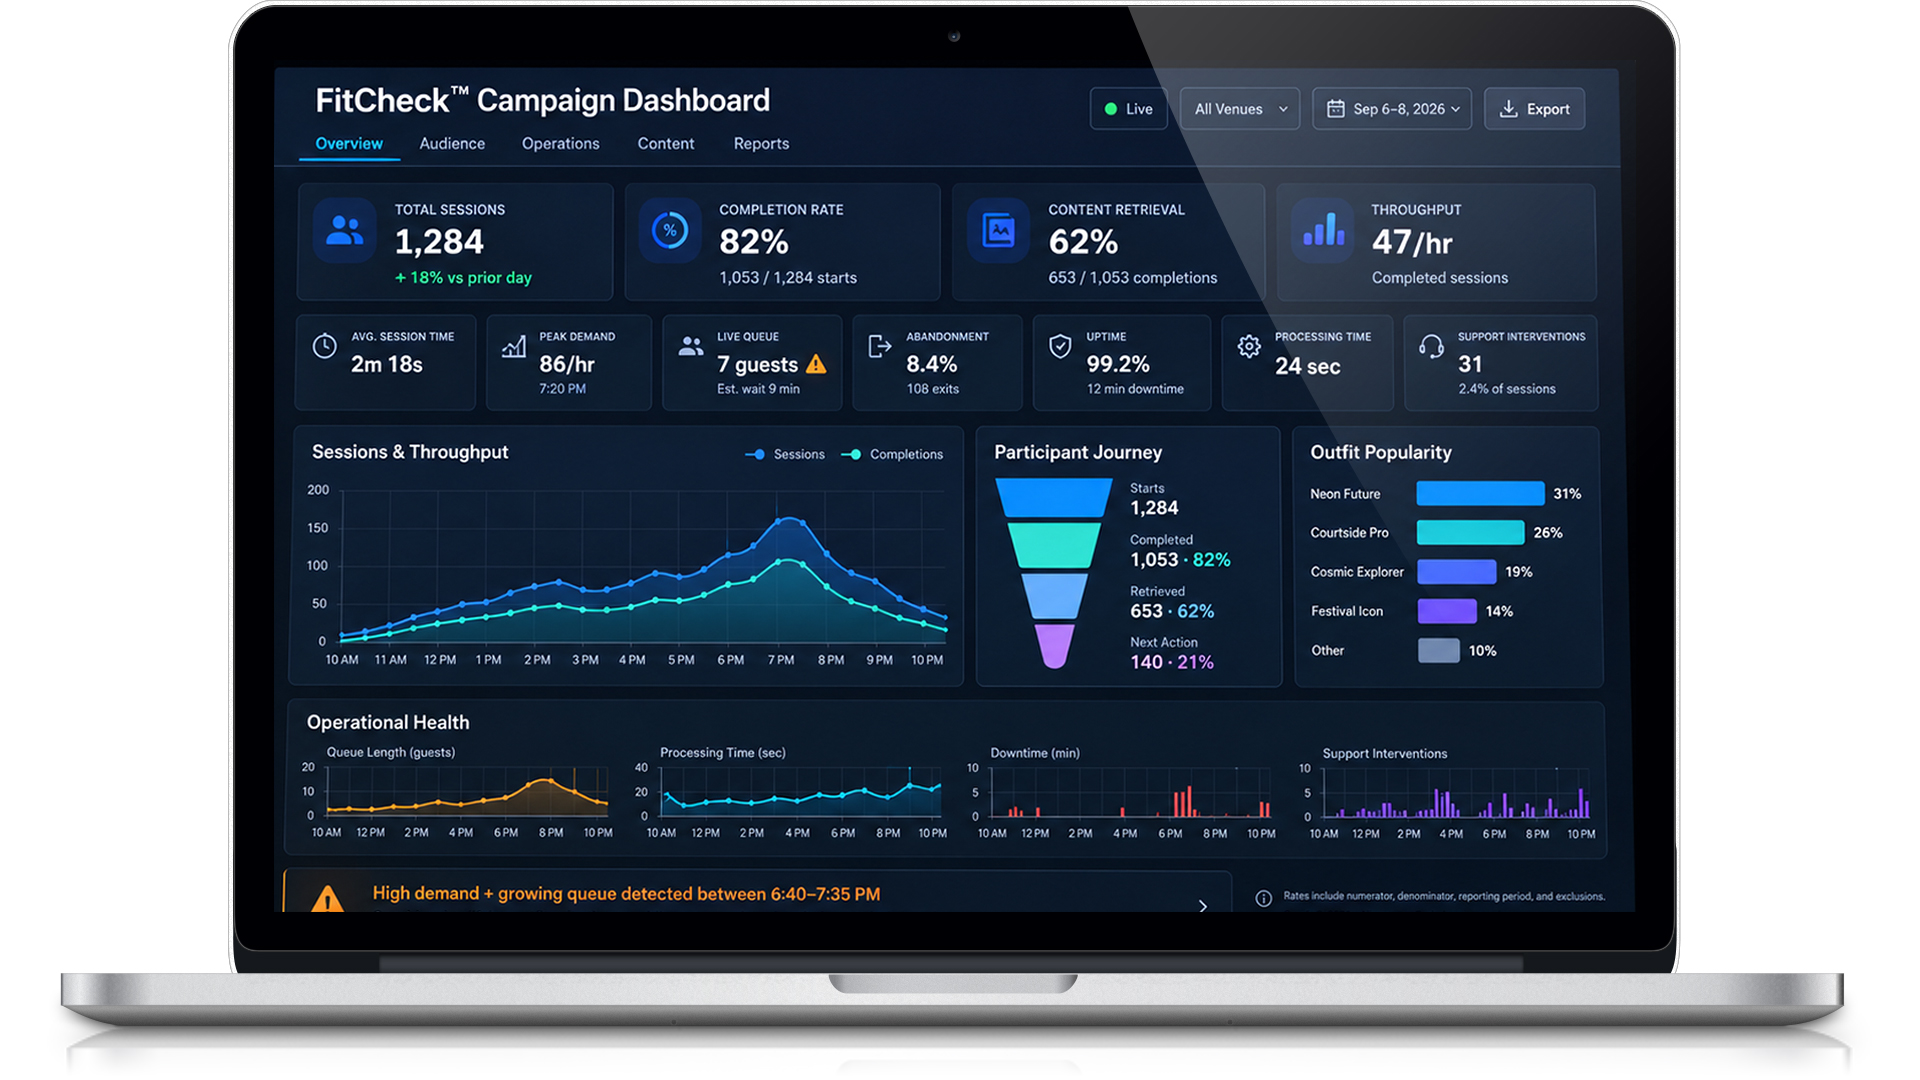
For example, high demand with low completions may be a throughput problem rather than a weak concept. A strong content-retrieval rate paired with a long queue may show that people value the output but the flow needs to be simplified. Frequent staff interventions may reveal an interface or accessibility issue.
Operational data turns a post-event report into a practical production tool.
Define the Metrics Before the Interface
Measurement should influence the experience design, not be added after it. If outfit popularity matters, each selection needs a trackable event. If product interest matters, the relevant item or collection must remain connected to the participant journey. If content retrieval matters, the system needs to register a successful delivery action. If repeat participation matters, the team needs a privacy-conscious method for distinguishing another session from another person.
Use Rates, Not Just Totals
Totals are useful, but rates make different days, venues, and formats easier to compare.
Completion rate compares completed experiences with starts. Retrieval rate compares successful content collections with completed sessions. Next-action rate compares the intended follow-up with the relevant participant group. Throughput compares completed sessions with operating hours.
Every rate should include its numerator, denominator, time period, and any exclusions. Without those details, two campaigns can appear comparable while measuring different things.
Report What the Data Can Actually Support
Experiential reports often move too quickly from participation to claims about awareness, affinity, or sales. Those outcomes may be possible, but they require the right evidence.
A completed interaction demonstrates participation. A download demonstrates content retrieval. A tracked visit demonstrates a next action. None of those measures alone proves a change in brand perception or a purchase caused by the mirror.
Use direct language in the final report:
- “Guests completed 820 sessions” is stronger than “The activation reached everyone at the event.”
- “Sixty-two percent of completed sessions retrieved content” is stronger than “Most guests shared socially” when shares were not measured.
- “The dedicated product page received 140 visits” is stronger than assigning all event sales to the installation.
Clear reporting builds confidence and makes future investment decisions easier.
Protect the Participant While Measuring
Collect only what the campaign needs. Explain when information is requested, what value the participant receives, and how it will be used. Separate required operational events from optional marketing consent. Establish retention and deletion rules before launch.Measurement should make the experience smarter, not make the participant feel watched.
Measuring the Groove Jones FitCheck™ Magic Mirror
The Groove Jones FitCheck™ Magic Mirror can be configured around the campaign’s desired journey, from the attract loop and outfit selection to photo or video capture and digital delivery. Optional data-capture integrations can connect the physical interaction to a broader marketing program when appropriate.
The most useful scorecard is the one designed for the specific activation. A fan experience, retail installation, themed event, and conference booth should not be judged by the same single metric. Start with the objective. Instrument the full journey. Include operational performance. Report only what the evidence supports.
That is how an attention-grabbing moment becomes a measurable brand experience.
Learn more about the FitCheck™ Magic Mirror or contact Groove Jones to plan an interactive experience and its measurement strategy.